What is water hardness?
The simple definition of water hardness is the amount of dissolved calcium and magnesium in the water. Hard water is high in dissolved minerals, both calcium and magnesium. You may have felt the effects of hard water, literally, the last time you washed your hands. Depending on the hardness of your water, after using soap to wash you may have felt like there was a film of residue left on your hands. In hard water, soap reacts with the calcium (which is relatively high in hard water) to form “soap scum”. When using hard water, more soap or detergent is needed to get things clean, be it your hands, hair, or your laundry.
Have you done a load of dishes in the dishwasher, taken out the glasses, and noticed spots or film on them? This is more hard-water residue—not dangerous, but unsightly. Many industrial and domestic water users are concerned about the hardness of their water. When hard water is heated, such as in a home water heater, solid deposits of calcium carbonate can form. This scale can reduce the life of equipment, raise the costs of heating the water, lower the efficiency of electric water heaters, and clog pipes. And, yes, mineral buildup will occur in your home coffee maker too, which is why some people occasionally run vinegar (an acid) through the pot. But hard water can have some benefits, too. Humans need minerals to stay healthy, and the National Research Council (National Academy of Sciences) states that hard drinking water generally contributes a small amount toward total calcium and magnesium human dietary needs.
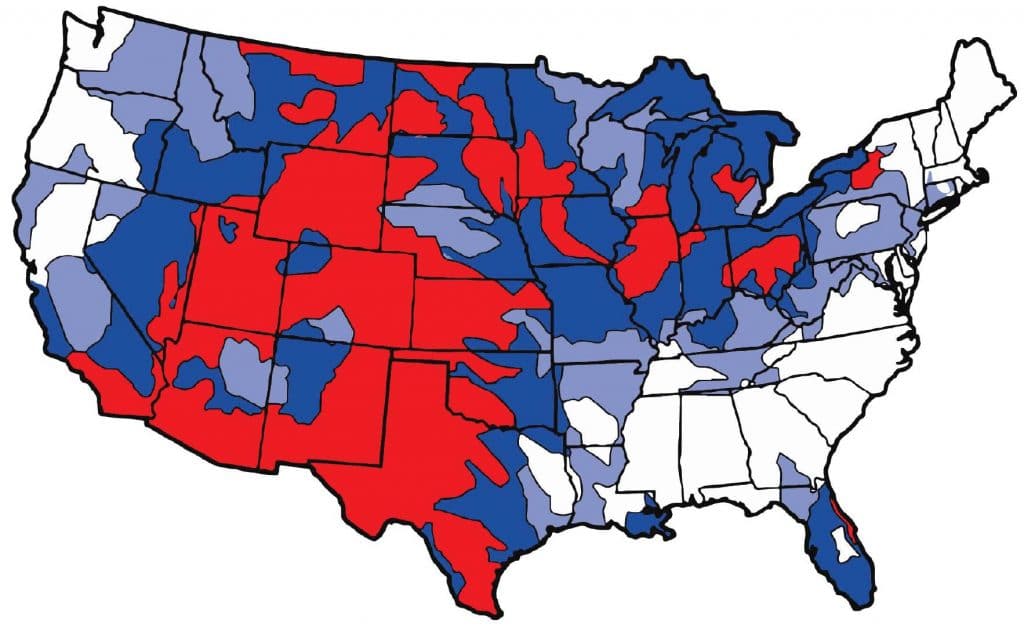
Water hardness in the United States


Water hardness is based on major-ion chemistry concentrations. Major-ion chemistry in groundwater is relatively stable and generally does not change over time. Although the map illustrates data from 1975, these data have been found to be accurate and useful in current assessments.
There are, however, several caveats about the nature, use, and interpretations of these data:
- The data illustrated represent water hardness on a national and regional scale and must be so interpreted;
- The 1975 data are not designed to be used to make local decisions or decisions on the scale of individual homeowner property; and
- Information that is directly relevant to water hardness and other chemical properties at a home or immediate locale should be provided by the local health agency, local water utility, or by the vendor of a local water-softening system
Source: https://water.usgs.gov
Measures of water hardness
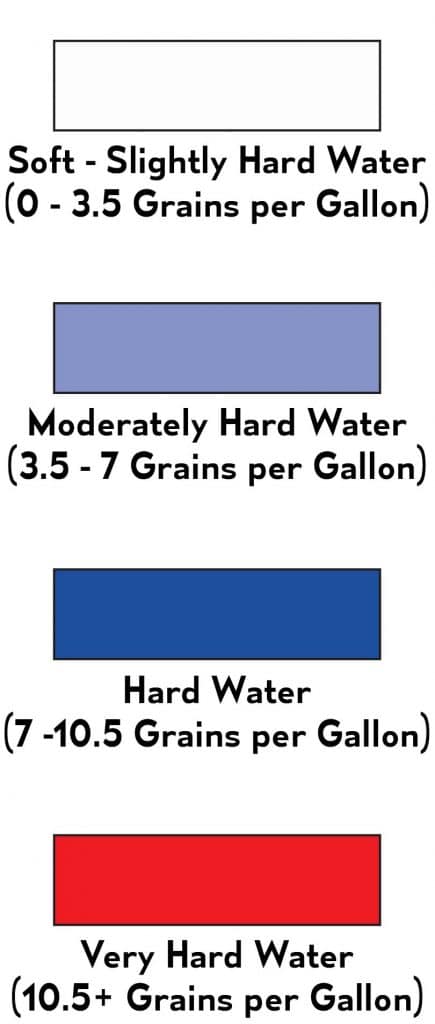
Hardness is caused by compounds of calcium and magnesium, and by a variety of other metals. General guidelines for classification of waters are: 0 to 60 mg/L (milligrams per liter) as calcium carbonate is classified as soft; 61 to 120 mg/L as moderately hard; 121 to 180 mg/L as hard; and more than 180 mg/L as very hard.
Water systems using groundwater as a source are concerned with water hardness, since as water moves through soil and rock it dissolves small amounts of naturally-occurring minerals and carries them into the groundwater supply. Water is a great solvent for calcium and magnesium, so if the minerals are present in the soil around a water-supply well, the hard water may be delivered to homes. Water hardness varies throughout the United States. In areas of the country where the water is relatively hard (see map below), industries might have to spend money to soften their water, as hard water can damage equipment. Hard water can even shorten the life of fabrics and clothes (does this mean that high-school students who live in areas with hard water keep up with the latest fashions since their clothes wear out faster?).
As this picture of an inside of a water-supply pipe shows, long-term movement of hard water through a pipe can result in what is called scale buildup. Just as in the human body where blood vessels can be reduced in inside diameter due to cholesterol buildup, water pipes can gradually close up resulting in less water movement through the pipe and a lowering of water pressure.
Mean hardness as calcium carbonate at NASQAN water-monitoring sites during the 1975 water year. Colors represent streamflow from the hydrologic-unit area. Map edited by USEPA, 2005. Modified from Briggs, J.C., and Ficke, J.F., 1977, Quality of Rivers of the United States, 1975 Water Year — Based on the National Stream Quality Accounting Network (NASQAN): U.S. Geological Survey Open-File Report 78-200.

